
Open an EV charging financial model and look at where each number came from. The energy rate is in a published tariff schedule. The charger price is on a quotation. The interest rate and tenor are in a sanction letter. The depreciation lives are in a schedule. Nearly everything is a fact, a rate or a convention, and you can put a document behind it.
One input is not like the others. Utilisation — how many hours a day the station actually sells, or equivalently how many units move through it — is a forecast about the behaviour of people who have not arrived yet. And it is not one input among many: it is the multiplier on the entire revenue side.
The one input that is not a fact
Revenue in this business is close to linear in throughput. Double the units sold and you roughly double the gross margin; halve them and you roughly halve it. Debt service does not move at all. So the coverage ratio a lender tests — the DSCR, cash available for debt service divided by what is owed that year — inherits the full volatility of the one number you cannot prove.
That is why the utilisation line gets more scrutiny than the capex it sits next to. A charger price that is 10% wrong changes the loan size. A utilisation figure that is 40% wrong changes whether the project can pay at all.
Why three hours a day keeps appearing
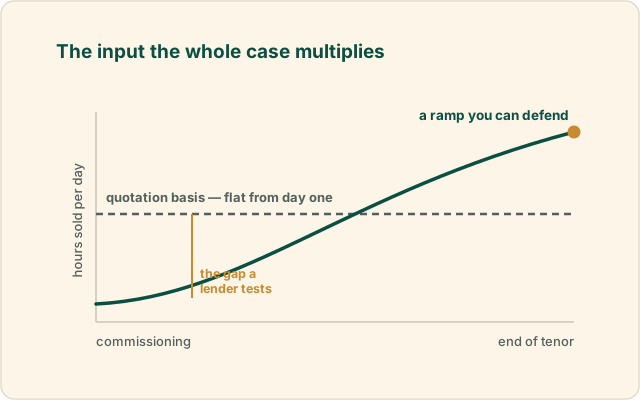
Vendor quotations routinely build the revenue case on an assumed three hours of charging a day. It is a convenient basis: it is easy to state, it looks modest, and it produces a satisfying payback. In our experience modelling real quotations against lender criteria, that basis is usually not bankable — and the reason is not arithmetic. The arithmetic in those sheets is often fine.
The reason is that the number has no provenance. It is a placeholder that gets promoted to a forecast as the document passes from the person selling hardware to the person seeking credit. Nobody has to lie for this to happen. The quotation was written to sell equipment, and a hardware quotation is simply not the kind of document that carries demand evidence.
The tell is easy to check on your own model, right now: can you write one sentence explaining where the utilisation figure came from, that does not contain the words “the vendor”? If not, that is the sentence a credit officer will ask you for.
What “defensible” means to a lender
Defensible does not mean conservative, and it certainly does not mean precise. It means the number has four properties. This is our advisory method rather than a published rule, but it maps directly onto how a credit appraisal reads:
- It has a provenance. One sentence, naming what was counted or measured and when. “Derived from published toll-plaza counts on this corridor for July 2026” is a provenance. “Industry standard” is not.
- It is a ramp, not a constant. Stations do not open at steady state. A model that runs year one at the same throughput as year five is asserting something nobody believes.
- It survives being moved. You should already know what the coverage ratio does at minus 20% and minus 30%, because that is the first thing that will be done to it. If a 20% cut breaks the loan, the project is thinner than the headline suggests and it is better to know now.
- It is consistent with the rest of the document. The sanctioned load, charger count, staffing and the throughput must describe the same station. An assumed utilisation that would require more simultaneous sessions than the connection supports is the kind of internal contradiction that ends a conversation.
The bar itself is public and specific. The benchmark our bankability check applies — and which our DPRs are written against — is an average DSCR of 1.50 or better, with a minimum of 1.20 in any single year. The two-part structure matters: an average can hide a bad early year, which is exactly when a lender is most exposed.
Four grades of evidence
Not all support for a utilisation number is worth the same. Ranked worst to best, with what each is actually good for:
| Basis | What it is worth | What to do with it |
|---|---|---|
| The vendor’s assumed hours | No provenance. It is an input to a sales document. | Replace it. Keep it only as a comparison line. |
| Analogy — “a station near here does X” | Anecdote, unless you have seen meter data. Reported numbers are usually peak-day numbers. | Use as a sanity check, never as the basis. |
| Corridor or catchment measurement from published data | The strongest evidence available before you build: toll-plaza counts and registry-derived EV share, each with its own provenance. | Use it to bound the transit case, then apply an explicit capture rate. |
| Metered throughput from a comparable operating site | The only actual measurement of the thing itself. | Use it — and disclose honestly how comparable the site really is. |
The third row is the one most projects can reach and most do not. India publishes two datasets that, combined, get you to a corridor estimate: monthly FASTag toll-plaza car counts, and vehicle registrations by RTO. Our EV traffic estimator is built on exactly those — the July 2026 published car count for 481 of the 701 plazas in its index, and pure-EV registrations across all 1,676 RTOs — and we describe how it works, and what it deliberately leaves out, in how many EV cars actually pass your site.
Model a ramp, not a number
The practical fix is to stop looking for “the” utilisation figure and write a ramp instead. That is why our DPR engine takes hours per day and days per year for each year rather than a single input: it is the shape a credit appraisal reads, and it forces you to say when you expect to reach the number you believe in.
Three things worth being deliberate about while you build it:
- Start below what you believe. Year one carries commissioning delays, an unfamiliar site and no habit among drivers. If your year-one figure equals your steady-state figure, you have not modelled a ramp, you have modelled a switch.
- Stop compounding once you get there. Growth you cannot evidence is the original error wearing a different hat. Flat at a defensible level reads as more credible than a curve that quietly doubles by year five.
- Say what your days-per-year assumes. Maintenance, outages and seasonal closures are real. An implicit 365 is a claim, whether or not you meant to make it.
One more honest caveat about published benchmarks generally, and ours in particular: the site-type utilisation figures in our own ROI calculator — urban, highway, mall, office, fleet depot — are internal advisory estimates, not measured industry data, and they are labelled that way inside the tool. Use them to frame a range, not to carry a business case.
Test it before someone else does
The most useful hour you can spend on this is running your own numbers through the coverage test before a banker does it for you. The bankability check computes DSCR, IRR and payback from your figures, free, before any payment, and nothing you enter is stored.
Run it three times, deliberately:
- Your defensible ramp. The one you can write a provenance sentence for.
- The same ramp cut by 20%. This is the stress a credit officer will apply without telling you.
- The vendor’s basis. Not because you will submit it, but because seeing the gap between it and your own tells you exactly how much of the headline return was resting on an assumption nobody sourced.
Sources and basis
| Claim | Basis | Status |
|---|---|---|
| Bankable means average DSCR of 1.50 or better with a minimum of 1.20 in any single year | The benchmark applied by our bankability check and used in our DPRs; published on the DPR tool page | our standard |
| Vendor quotations commonly assume about three hours of charging a day, and that basis is usually not bankable | Our modelling of real quotations against lender criteria, stated on the DPR tool page | advisory opinion |
| Site-type utilisation benchmarks are estimates, not measured industry data | Internal advisory estimates, labelled as such inside our ROI calculator | estimated |
| Published FASTag car counts cover 481 of the 701 plazas in our index for July 2026; pure-EV registrations cover 1,676 RTOs | IHMCL monthly ETC reports and VAHAN/Parivahan, as used by our EV traffic estimator | verified |
| The four properties of a defensible assumption, and the ranking of evidence grades | Advisory method, not a regulatory or lending rule | advisory opinion |