
Ask how much traffic passes a proposed charging site and you will get an answer quickly. Ask how much electric traffic passes it and the conversation usually stops, or turns into a percentage someone once heard. That is the number the revenue case depends on, and it is the one nobody measures.
Why the number is missing
There is no instrument in the road that knows what is under the bonnet. Toll systems count vehicles by class — car, bus, truck — not by fuel. The vehicle registry knows fuel type precisely, but it records where a vehicle was registered, not where it drives. Neither dataset was built to answer the question, and no third dataset exists that was.
So the number has to be constructed by joining the two, and the construction has to be honest about every step where a judgement was inserted. That is the whole discipline: not producing a figure, but producing a figure you can argue with.
The two datasets that exist
Toll-plaza counts, monthly, per plaza
IHMCL publishes monthly electronic-toll-collection reports giving transaction counts per plaza by vehicle class. That is a real measurement of real vehicles at a real point on the highway — the closest thing to a traffic counter that exists in public.
In the plaza index behind our estimator, 481 of 701 plazas carry the published July 2026 car and jeep count. Plazas the report does not name-match fall back to the median of measured counts on the same highway, then the state, then the national median — and those rows are marked assumed, not quietly mixed in with the measured ones. The full series runs January 2025 to July 2026, nineteen months, which is what makes growth and seasonality measurable rather than assumed. Where a plaza is missing from an early-2025 month, that means it was absent from a partial report — not that no traffic passed.
Registrations, by RTO, by fuel
VAHAN/Parivahan records registrations by RTO. Two separate pulls do two different jobs. The first, filtered to pure EV — battery-electric only, hybrids excluded, because a hybrid never needs a public charging session — covers all 1,676 RTOs and gives the numerator. The second, an all-fuel pull with zero unresolved offices, gives the denominator: the total car fleet each RTO has registered.
From the plaza to your gate
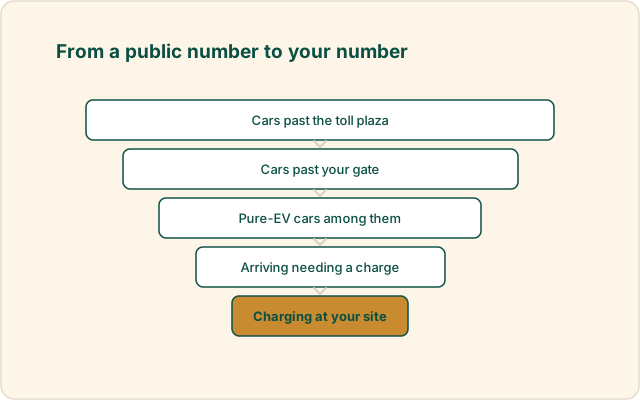
The conversion runs in five deterministic stages. Identical inputs always return identical output — there is no model guessing anywhere in it — and every coefficient is shown with its range and its provenance so you can disagree with it and immediately see what your disagreement is worth.
- Base flow. Plaza transactions divided by days in the month, then corrected for exempt and non-FASTag passages, for month seasonality, and for the transfer from the plaza to your actual location. If your site sits between two plazas, both are kept: they form an interval rather than a chosen point, and if they disagree by more than 25% after correction the tool flags it instead of averaging the disagreement away.
- EV share of the flow. The catchment-weighted pure-EV share of registered stock, multiplied by a highway exposure factor. You choose which RTOs plausibly feed the corridor and how much each contributes; weights normalise automatically.
- Projection. Traffic growth is capped at a screening rate. EV adoption follows a logistic curve toward a ceiling — never a compounding percentage, which is how five-year demand forecasts end up implying more EVs than cars.
- Capture. Passing EV to paying session: the probability a car arrives needing a charge, the probability it stops given that it needs one, and your share against competing stations. Then kWh per session gives kWh per day.
- Economics. Against capex, tariff and variable cost, the same run produces the break-even throughput, so you can see the gap between what the corridor offers and what the project needs.
Three ways it can mislead you
Every one of these is a place where an estimate of this kind can be confidently wrong. They are worth knowing whether or not you use our tool to do the arithmetic.
1. FASTag growth is not traffic growth
Year-on-year growth measured from plaza counts runs high, and part of that is rising FASTag compliance rather than more cars on the road. Same-plaza, same-month comparison removes the effect of the plaza network itself growing, but not this one. Our projection therefore caps growth at 7% a year for screening regardless of the observed figure, and flags when the cap binds. If you are doing this by hand, apply a cap of your own and say so — an uncapped FASTag growth rate compounded over five years produces a number you cannot defend.
2. Stock share and purchase share are different questions
Cumulative fleet share buries today’s adoption under a decade of petrol purchases and reads low. Recent purchase share — the EV percentage of cars sold last quarter — overstates what is actually on the road today and reads high. The truth for highway flow sits between the two, which is why the estimator takes recent registration counts separately and computes the momentum they imply rather than picking one of the two numbers and calling it the answer.
3. The exposure factor is genuinely contested
Are EVs over- or under-represented on highways relative to their share of the registered fleet? Range anxiety argues they avoid long runs, which puts the factor below 1. The per-kilometre running-cost advantage argues the EV is exactly the car a household picks for a long trip, which puts it above 1. We default it to a neutral 1.0 and mark the direction as disputed rather than quietly picking a side. Set it deliberately for your corridor; do not let a default carry your case.
What it leaves out — and why a low number is not a “no”
This kind of estimate models transit car traffic, and nothing else. Absent from it entirely:
- Induced demand — a charger that exists changes the routes people are willing to drive.
- Electric buses and trucks, whose energy per session dwarfs a car’s.
- Captive fleet demand — the cab aggregator or logistics operator that contracts for a depot and never appears in transit flow.
- Local demand that never passes a toll plaza at all.
What to do with the number
Three things, in order.
Convert it into a ramp, not a headline. A corridor figure is a statement about the road, not about your first year of trading. Turning it into a year-by-year utilisation you can defend is a separate discipline, and the one lenders actually test — see how to defend the utilisation number your whole case rests on.
Carry the provenance with it. The value of a measured estimate is the sentence attached to it: which plazas, which month, which RTOs, which coefficients you changed and why. Strip that sentence and you are back to an assumed number, however carefully it was computed.
Check the site can physically take it. Traffic is irrelevant if the plot cannot get the power — the electrical screen rejects more sites than demand ever does. GeoSite handles that half, and the four tests, in order explains why it comes first.
Sources and basis
| Claim | Basis | Status |
|---|---|---|
| 481 of the 701 plazas in the index carry the published July 2026 car/jeep count; the rest fall back to same-highway, state, then national medians and are marked assumed | IHMCL monthly ETC reports, joined to the NHAI Toll Information System plaza index | verified |
| Monthly plaza series runs January 2025 to July 2026; February–May 2025 reports are partial, so gaps mean absent-from-report rather than zero traffic | IHMCL monthly ETC reports, nineteen months parsed | verified |
| Pure-EV registrations across 1,676 RTOs; a separate all-fuel pull supplies each RTO’s total car fleet, so EV share of fleet is computed rather than assumed | VAHAN/Parivahan Analytics — pure-EV extraction as on 10 August 2026, all-fuel extraction as on 25 August 2026 | verified |
| Traffic growth capped at 7% a year for screening because FASTag-derived growth conflates real traffic growth with rising compliance | A deliberate screening choice in our estimator, flagged in the output whenever the cap binds | advisory opinion |
| Highway exposure factor defaults to a neutral 1.0 and its direction is disputed | Disclosed in the tool rather than resolved; set per corridor | open question |
| Induced demand, electric buses and trucks, captive fleet demand and the long-trip running-cost preference are all excluded, and each would raise the estimate | The estimator’s published omissions register | stated limitation |