
People arrive at a bank with a vendor’s glossy projection showing a three-year payback and are surprised when the conversation goes nowhere. The reason is almost never that the banker dislikes EV charging. It is that the document answers a different question from the one being asked.
You are thinking about return: what do I make on my money. The lender is thinking about coverage: in every single year of this loan, does the cash this project throws off exceed what it owes me — with room to spare when things go wrong?
The one ratio that decides it
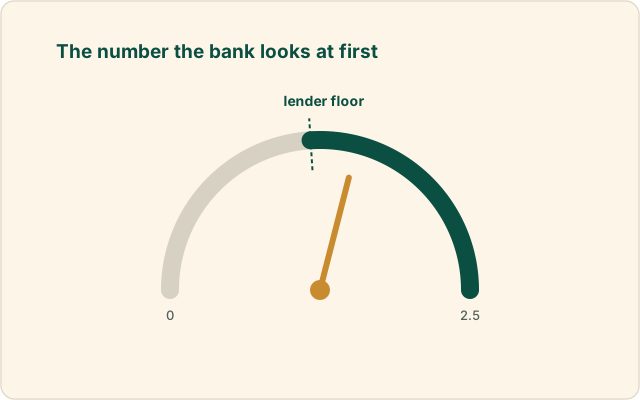
That question has a name: the Debt Service Coverage Ratio.
It is deliberately simple. Take the cash the project generates in a year, after operating costs but before loan repayments. Divide it by everything owed on the loan that year — interest plus principal.
Note what the ratio does not care about. Not your total profit over ten years. Not the payback period. Not how large the opportunity is. It is a year-by-year survival test, and a project can have an attractive lifetime return while failing it badly in years two and three — which is precisely when a lender is most exposed.
The bar you actually have to clear
A ratio of 1.00 is not a pass. It is the definition of no margin at all. The benchmark our bankability check applies — and which our DPRs are written against — is:
The two-part structure matters. An average of 1.50 alone can hide a disastrous early year, so the floor of 1.20 in any year does independent work. A project that averages comfortably but dips to 0.9 in year two is not fundable on those numbers, and no amount of averaging fixes it.
Why most vendor projections fail before page two
Here is the thing we see most often, and it is worth stating plainly because it is where the money is lost.
Vendor quotations routinely build their revenue case on an assumed utilisation of around three hours of charging per day. It is a convenient basis. It produces a satisfying payback number. And in our experience modelling real quotations against lender criteria, that basis is usually not bankable — because it is an assumption presented as a forecast, with nothing measured behind it.
The failure is not arithmetic. The arithmetic in those sheets is often fine. The failure is that the single input the entire case rests on has no evidence under it, and a credit officer’s job is to find exactly that input and test it. When they do, and the number moves, the coverage collapses — because revenue in this business is close to linear in throughput while the debt service is fixed.
What a bank-ready DPR has that a vendor projection does not
A Detailed Project Report is not a longer version of the quotation. It is a different document with a different burden of proof:
- A stated, defensible demand basis — where the throughput assumption comes from, not merely what it is.
- Year-by-year DSCR, shown for every year of the loan, not a single blended figure.
- Sensitivity analysis — what happens to coverage if throughput is 30% below plan, if the landed electricity rate rises, if commissioning slips two quarters. A lender will run these anyway; better that your document ran them first.
- The regulatory position stated correctly — including that your service charge per unit is capped, so the case cannot be rescued by assuming higher pricing later.
- Separated verdicts. Whether the station is operationally profitable, whether the investment clears your hurdle, and whether the debt is serviceable are three different questions with three different answers.
- Honest labelling of what is unverified, so the reader knows which numbers are measured and which are assumed.
Check your own project before a banker does
You do not need to buy anything to find out where you stand. Our bankability check takes a project’s inputs and returns the coverage verdict against the benchmark above — bankable, marginal, or not bankable — along with the warnings that produced it. No sign-up, no charge.
Our strong advice is to run it on your vendor’s own numbers first, unchanged. If it comes back short, you have learned the most valuable thing available to you at this stage, and you have learned it before committing capital rather than after.
Sources and basis
| Claim | Basis | Status |
|---|---|---|
| Bankability benchmark: average DSCR 1.50 or better, minimum 1.20 in any year | The benchmark applied by our own bankability check and DPR methodology | stated methodology |
| Vendor quotations commonly assume ~3 hours/day utilisation, and that basis is usually not bankable | Our experience modelling supplied quotations against lender coverage criteria — an advisory observation, not a survey | advisory opinion |
| Service charge per unit is capped, so higher pricing cannot rescue a weak case | Ministry of Power — Guidelines for Installation and Operation of EV Charging Infrastructure (2024); see our cost article for the ceilings | verified |